Posts

Showing posts from December, 2015

Featured Post

SQL Interview Success: Unlocking the Top 5 Frequently Asked Queries

Image
 Here are the five top commonly asked SQL queries in the interviews. These you can expect in Data Analyst, or, Data Engineer interviews. Top SQL Queries for Interviews 01. Joins The commonly asked question pertains to providing two tables, determining the number of rows that will return on various join types, and the resultant. Table1 -------- id ---- 1 1 2 3 Table2 -------- id ---- 1 3 1 NULL Output ------- Inner join --------------- 5 rows will return The result will be: =============== 1  1 1   1 1   1 1    1 3    3 02. Substring and Concat Here, we need to write an SQL query to make the upper case of the first letter and the small case of the remaining letter. Table1 ------ ename ===== raJu venKat kRIshna Solution: ========== SELECT CONCAT(UPPER(SUBSTRING(name, 1, 1)), LOWER(SUBSTRING(name, 2))) AS capitalized_name FROM Table1; 03. Case statement SQL Query ========= SELECT Code1, Code2,      CASE         WHEN Code1 = 'A' AND Code2 = 'AA' THEN "A" | "A

What is so Trendy in Data Visualization and Reporting

Data Visualization: Data visualization is the process that defines any effort to assist people to understand the importance of data by placing it in a visual context.  Patterns, trends, and correlations that might be missed in text-based data can be represented and identified with data visualization software. It is a graphical representation of numerical data. This is one of the Hot skills in the market, you will get the highest salary. Types of data visualization Visual Reporting Visual reporting uses charts and graphics to represent business performance, usually defined by metrics and time-series information. The best dashboards and scorecards enable the users to drill down one or more levels to view more detailed information about a metric A dashboard is a visual exception report that signifies the ambiguities in performances using visualization techniques Visual Analysis Visual-analysis allows users to visually explore the data to observe the data and discove

Complete Videos of IBM Watson IoT

Image
Watson IoT is a set of capabilities that learn from, and infuse intelligence into, the physical world. The Internet of Things-generated data is growing twice as fast as social and computer-generated data, and it is extremely varied, noisy, time-sensitive and often confidential. You can learn quickly IBM watson for IoT quickly. Complexity grows as billions of devices interact in a moving world. This presents a growing challenge that will test the limits of programmable computing.  What is Cognitive IoT Cognitive IoT is not explicitly programmed. It learns from experiences with the environment and interactions with people.  It brings true machine learning to systems and processes so they can understand your goals, then integrate and analyze the relevant data to help you achieve them. References IBM Watson IoT videos 5 Challenges in internet of things Follow us on social media Facebook Twitter

3 best Self Study Materials on Spark Mlib

Image
Apache Spark is a fast and general-purpose cluster computing system. It provides high-level APIs in Java, Scala and Python, and an optimized engine that supports general execution graphs. An execution graph describes the possible states of execution and the states between them. Spark also supports a set of higher-level tools including Spark SQL for SQL and structured data processing, MLlib for machine learning, GraphX for graph processing, and Spark Streaming. #Spark   Review of Spark Machine Language Library (MLlib): MLlib is Spark's machine learning library, focusing on learning algorithms and utilities, including classification, regression, clustering, collaborative filtering, dimensionality reduction, as well as underlying optimization primitives. Why MLlib? It is built on Apache Spark, which is a fast and general engine for large scale processing. Supposedly, running times or up to 100x faster than Hadoop MapReduce, or 10x faster on disk. Supports writing applications

5 Challenges Mostly People Look in Internet-of-Things

Image
Challenges in the internet of things you need to know. I have covered in this post all the top challenges involved. The challenges are Security Privacy Standards Legal Development Issues Security While security considerations are not new in the context of information technology, the attributes of many IoT implementations present new and unique security challenges. Addressing these challenges and ensuring security in IoT products and services must be a fundamental priority . Users need to trust that IoT devices and related data services are secure from vulnerabilities, especially as this technology becomes more pervasive and integrated into our daily lives. Poorly secured IoT devices and services can serve as potential entry points for cyber-attack and expose user data to theft by leaving data streams inadequately protected.  The interconnected nature of IoT devices means that every poorly secured device that is connected online potentially affects the security an

4 Top Data Scientist Skills to be Successful

Image
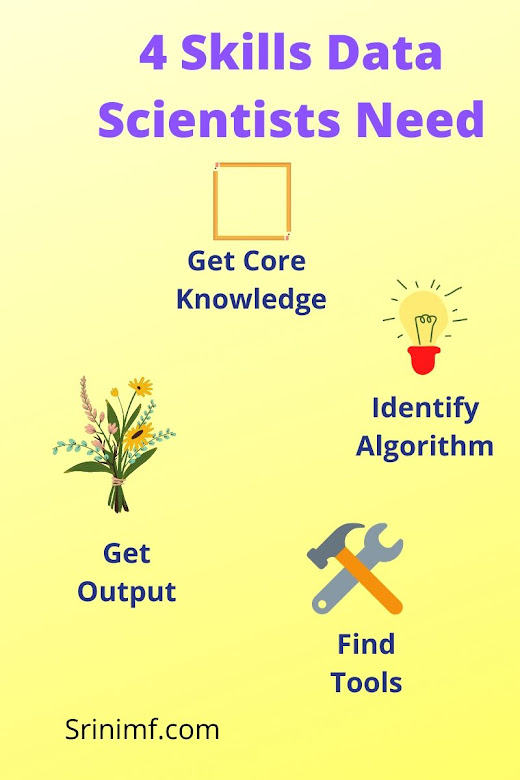
Data science is a combination of technical and general skills. As an analyst, you are responsible to provide useful information to the client. Below is a useful list of skills. Top Data Scientist Skills. 1. Paradigms and practices. This involves data scientists acquiring a grounding in core concepts of data science, analytics, and data management.  Data scientists should easily grasp the data science life cycle, know their typical roles and responsibilities in every phase, and be able to work in teams and with business domain experts and stakeholders.  Also, they should learn a standard approach for establishing, managing, and operationalizing data science projects in the business. 2. Algorithms and modeling. Here are the areas with which data scientists must become familiar: linear algebra,  basic statistics,  linear and logistic regression,  data mining,  predictive modeling,  cluster analysis,  association rules,  market-basket analysis,  decision tr

What is the meaning of Agile

Image
Agile Vs Scrum Agile is a time boxed, iterative approach to software delivery that builds software incrementally from the start of the project, instead of trying to deliver it all at once near the end. It works by breaking projects down into little bits of user functionality called  user stories , prioritizing them, and then continuously delivering them in short two week cycles called  iterations . Agile scales like any other software delivery process. Not that well . Look - scaling is hard. There is no easy way to magically coordinate, communicate, and keep large groups of people all moving in the same direction towards the same cause. It's hard work. The one thing Agile does bring to the conversation, is instead of looking for ways to scale up your project, look for ways to scale things down.

What is 3 Tier Architecture in QlikView

Image
The QlikView is a Windows-based desktop tool that is used by business analysts and developers to create a data model and to layout the graphical user interface (GUI or presentation layer) for QlikView apps. It is within this environment where a developer will use a SQL-like scripting environment augmented by ‘wizards’) to create the linkages (connection strings) to the source data and to transform the data e.g. rename fields, apply expressions) so that it can be analyzed and used within the UI, as well as re-used by other QlikView files. Related: QlikView+Tableau+Jobs (Search and know skills needed) The QlikView Desktop is also the environment where all user interface design and user experience is developed in a drag-and-drop paradigm: everything from graphs and tables containing slices of data to multi-tab architectures to application of color scheme templates and company logos is done here. Qlik View Server (QVS) The QVS is a server-side product that contains the in-memory

How To Master Life Cycle Of Scrum In Only One Day!

Image
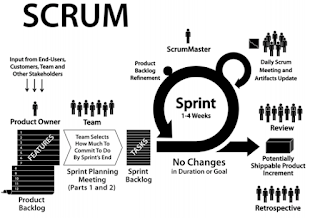
Scrum is an iterative, incremental framework for projects and product or application development. It structures development in cycles of work called Sprints. These iterations are no more than one month each, and take place one after the other without pause. The Sprints are timeboxed – they end on a specific date whether the work has been completed or not, and are never extended. At the beginning of each Sprint, a cross-functional team selects items 5 (customer requirements) from a prioritized list. Related: Top rated jobs in Scrum The team commits to complete the items by the end of the Sprint. During the Sprint, the chosen items do not change. Every day the team gathers briefly to inspect its progress, and adjust the next steps needed to complete the work remaining. At the end of the Sprint, the team reviews the Sprint with stakeholders, and demonstrates what it has built. (Frame work of Scrum) People obtain feedback that can be incorporated in the next Sprint. Scrum emp

The best answer for 'Efficient Workbook' in Tableau

Image
There are several factors that define an “efficient” workbook. Some of these factors are technical and some more user-focused. An efficient workbook is: A workbook that takes advantage of the “principles of visual analysis” to effectively communicate the message of the author and the data, possibly by engaging the user in an interactive experience. A workbook that responds in a timely fashion. This can be a somewhat subjective measure, but in general we would want the workbook to provide an initial display of information and to respond to user interactions within a couple of (< 5) seconds.  Tableau latest version is 9.1.2 as on writing this post Tableau version 8 and Version 9 differences Individual Query time improved by 10x Dashboard Query times improved by 9x Query Fusion improving times by 2x And Query Caching improving times by 50x

QlikView top capabilities comparing to other reporting tools

Image
One of the QlikView’s primary differentiators is the associative user experience it delivers. QlikView is the leading Business Discovery platform . QlikView Real Features -  To Make Visible Your Data, Highly Useful in Data Interpretation It enables users to explore data, make discoveries, and uncover insights that enable them to solve business problems in new ways. Business users conduct searches and interact with dynamic dashboards and analytics from any device. Users can gain unexpected business insights because QlikView Works the way the mind works. With QlikView, users can navigate and interact with data any way they want to — they are not limited to just following predefined drill paths or using preconfigured dashboards. Users ask and answer questions on their own and in groups and teams, forging new paths to insight and decision. With QlikView, discovery is flexible . Business users can see hidden trends and make discoveries like with no other BI platform on th

QlikView Server vs Publisher Top Differences Really Useful to Your Project

Image
The differences between QlikView Server and publisher, I have given for your reference. These are related to internally how differ each other. QLIKVIEW SERVER The QVS is a server-side product.  It contains an  in-memory analytics engine , which handles all client/server communication between a QlikView client (Desktop, IE plugin, AJAX, or Mobile) and the server. The Administrator can have access to the management console to control all aspects of the server deployments (including security, clustering, distribution, etc.)  It also includes a web server to provide front-end access to the documents within. The web server’s user portal is known as Access Point. (It’s important to note that while the QVS contains its web server, one can utilize Microsoft IIS (Internet Information Server) for this purpose, too). The QVS handles client authorization against existing directory providers (Microsoft Active Directory, eDirectory) It also performs read and write to ACLs (access control lists) for

2 Scaling-Up And Scaling-out QlikView's Ideas! That You Can Never Miss

Image
In scale-up architecture A single server is used to serve the QlikView applications. In this case, as more throughput is required, bigger and/or faster hardware (e.g. with more RAM and/or CPU capacity) are added to the same server. The Scale-up architecture In scale-out architecture More servers are added when more throughput is needed to achieve the performance necessary. It is common to see the use of commodity servers in these types of architectures.  As more throughput is required new servers are added, creating a clustered QlikView environment. In these environments, QlikView Server supports load sharing of QlikView applications across multiple physical or logical computers.  QlikView load balancing refers to the ability to distribute the load (i.e. end-user sessions) across the cluster in accordance with a predefined algorithm for selecting which node should take care of a certain session. QlikView Server version 11 supports three different load balancing algorithms. Belo

Storage Node Vs Compute Node

Image
Here are the differences between compute node vs storage node Nodes are two types. Those are compute and storage. The compute node process business logic whereas the storage node stores the data. Compute node Vs. Storage node Compute Node A computer (machine) where you can execute actual business logic. The two parameters it might have are RAM and CPU. Storage Node Stores the processing-data where your file system resides Compute and storage nodes you can find at one location. It designates block storage. References Node.js in action